
Quick Balance access
| Level: | |
| Variable: | |
| Country/Region: | |
* you must be logged in to use this feature, access this page through HTTPS, and allow pop-up windows. | |
PFU Database
Last change: 6 November 2016The PFU database contains time series from 1900 through 2014 of primary energy/exergy, final energy/exergy and useful energy/exergy. The data are organized:
- Geographically: on the lowest level by 15 countries and 5 other regions. They are aggregated into the 5 global regions in accordance with the Global Energy Assessment.
- by energy carrier: into 12 energy carrier categories
- by sector: industry; transport; the aggregate of commercial, residential, agriculture, public and other; and non-energy uses
- by end-use: thermal uses (high-temperature and low-temperature), light, stationary power, transport, feedstocks and other end-uses
This database was created by Simon De Stercke. The document IR-14-013 explains its construction.
An update including increasing the most recent year with data from 2010 to 2014 was performed in October 2016.A short tutorial on the use of the web database can be found below, as well as brief descriptions of the different categories. If you experience technical problems with this database, please contact the PFU database administrators.
A short tutorial on the use of the database
Navigation tabs
At the upper end of the browser window five navigation tabs can be found that provide different functionality of the web database. These five tabs are described in more detail in the following section. The data in the PFU database can be viewed online through two of the tabs shown on top of the screen, “Sectors” and “Series”, which present the data from a slightly different perspective.About tab
The “About” page, which you are currently reading, provides information about the database as well as instructions on how to use the database.
Sectors tab
The “Sectors” view allows selecting multiple variables from a single region. This view is most useful for displaying a set of variables, for example all energy carriers of industrial final energy consumption or of a specific use. Again, if the variables can be added in a meaningful way (e.g. different energy carriers of one sector) a stacked area graph is shown. Please note that it is necessary to mark a variable name (highlighted in blue) in addition to selecting variables for the graph on the right hand side to be updated (see also under (3) Variables below).
Series tab
The “Series” view allows selecting a single variable from multiple regions. The preview graph on the right is always a line graph and is most useful to compare trends across different pathways in one or multiple regions.
Database view structure
When viewing the database through any of the two tabs indicating different aggregations of data (i.e. “Sectors” or “Series”), the following query fields are in the left upper middle of the screen:
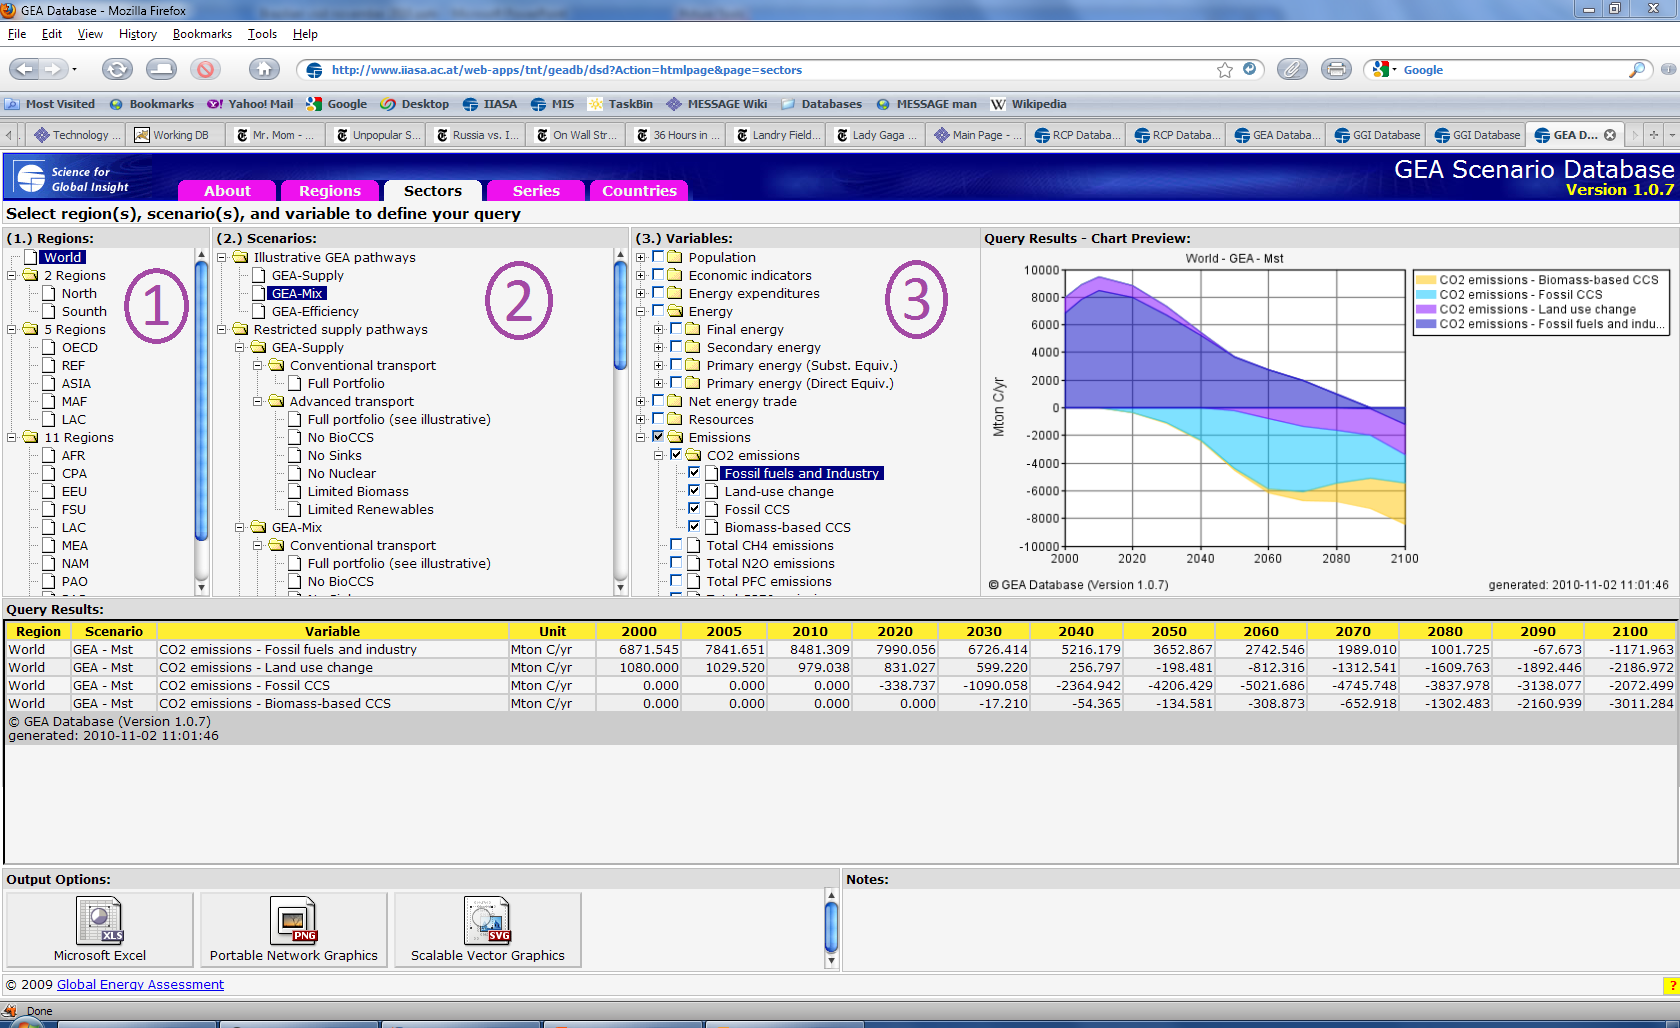
(1) Regions
In the upper left area of the screen is a field named “Regions”. This field is used for choosing the region or regions for which the data is shown. If data is aggregated over sectors (i.e. data is accessed through the tab “Sectors”), only single region can be chosen at a time.
(2) Scenarios
This field is used for choosing the scenario for which the data is shown. Multiple scenarios can be chosen simultaneously only if the aggregation method used is “Series”. For now, the only scenario is historical.
(3) Variables
This field is used for choosing the variable or variables for which the data is shown. Note that if the aggregation used is “Series”, only a single variable can be presented at a time.
The desired variables are selected by ticking the box next to the desired variable in the Query Results field. This allows you to define the required aggregation freely – all variables marked will be included in the aggregation. If no tick box is shown only a single variable can be selected and you may want to change to a different view.
Note you must tick at least one box or select a variable in each of the three input fields and click on any of the input options to generate (updated) figures and tables!
The output fields show a graphical and numerical view of the chosen data:
Query Results - Chart Preview
Displays a graph of the chosen on the right of the screen. The graph is either a stacked coloured graph or line graph in the “Sectors” views, and a line graph for the “Series” views.
Query Results
Shows the results in numerical format.
Output Options
Allows exporting of the selected PFU data into MS Excel or to higher-resolution PNG or SVG graphical formats (graph open in a new window). Full time series will be included in the Excel file, even if only selected years are shown in the "Query Results" frame.
Notes
Shows any information that is relevant to interpreting the chosen variables. If you hover your pointer over the ? box in the far bottom right, you will see information about the pathway and variable names that the database uses internally.
Energy/Exergy levels
By energy/exergy levels or stages, I mean the level at which energy/exergy is quantified down the energy/exergy chain from primary energy (raw, supply) to energy/exergy service provision (comfort, mobility, ...). The three levels at which data are reported are primary, final and useful, in terms of energy as well as in terms of exergy.
- Primary E(n/x)ergy: raw materials for fuels, energy output (direct equivalent) for non-fuel and nuclear energy carriers
- Final e(n/x)ergy: e(n/x)ergy quantified at the point of sale/use.
- Useful e(n/x)ergy: e(n/x)ergy that serves a useful purpose (e.g. light, heat for comfort, ...) after conversion of final e(n/x)ergy by an energy converter.
Description of sectors
Final energy use has been split up into 4 sectors for energy purposes, and a fifth which is non-energy uses.
- Industry: manufacturing of all sorts, excluding non-energy uses of the energy carriers
- Residential / Commercial: residential and commercial sector direct energy use, but also including agriculture and forestry
- Transport: commercial/private transport, including fishing uses and excluding international aviation and maritime bunker fuels
- Bunkers: international aviation and maritime bunker fuels
- Non-energy: all uses for purposes other than direct energy provision, e.g. feedstocks
Description of energy carriers
Energy carriers are grouped into 12 categories, that are a superset of the 63 energy carrier categories that the IEA reports. For historical consistency with primary energy data, the energy carriers have been grouped according to their origin (e.g. manufactured gases from coal are a part of coal products). For non-fuel (and nuclear) energy carriers, the primary energy is calculated assuming a direct equivalent for the part that is transformed into electricity or heat. Energy carrier categories:
- Biomass: both solid and liquid, includes charcoal and waste
- Coal Products: all products originating from coal or peat, including manufactured gases
- Electricity
- Geothermal
- Heat
- Hydro: includes tide, wave and ocean energy
- Natural Gas
- Nuclear
- Other
- Petroleum Products: crude oil and refined petroleum products, including liquified petroleum gases
- Solar: photovoltaic and thermal
- Wind
Description of end-uses
The end-use is defined as the nature of the useful energy at the final stage of conversion, and hence also expresses what the energy is used for.
- Light: illumination
- Low-temperature heat: thermal uses in the residential/commercial sector, for heating or cooling e.g. hot water for sanitation.
- High-temperature heat: thermal uses in industry (also medium-temperature), e.g. process heat in manufacturing industry.
- Stationary power: mechanical uses, the converters for which are not moving. Examples include blenders and conveyor belt drives.
- Transport: mechanical uses for the purpose of self-propulsion, e.g. train locomotive, car engine, ...
- Feedstocks: energy carriers used for non-energy purposes, e.g. plastics
- Other end-uses
Definition of regional acronyms used in the database
The results in the database are shown with varying regional aggregation. On the most disaggregated level there are 20 regions. 15 of these are the (former) countries Australia, Brazil, Canada, China, France, the Former Soviet Union, Germany, India, Italy, Japan, Nigeria, Poland, South Africa, the United Kingdom and the United States. The other 5 regions are the complements for the 5 region level aggregation.
Aggregation on the 5 region level
OECD 90: Countries that were OECD members in 1990, i.e. countries that make up the Western Europe, North America and Pacific OECD regions.
Reforming Ecomonies: Countries of Central and Eastern Europe and the Former Soviet Union undergoing economic reform.
Asia: This region includes the Asian countries that make up the South Asia, Centrally planned Asia and China and Other Pacific Asia regions.
Middle East and Africa: This region includes the African and Middle Eastern countries that make up the Sub-Saharan Africa and Middle East and North Africa regions.
Latin America and the Caribbean: This region is the same as the Latin America and the Caribbean region in aggregation on the 11 region level.
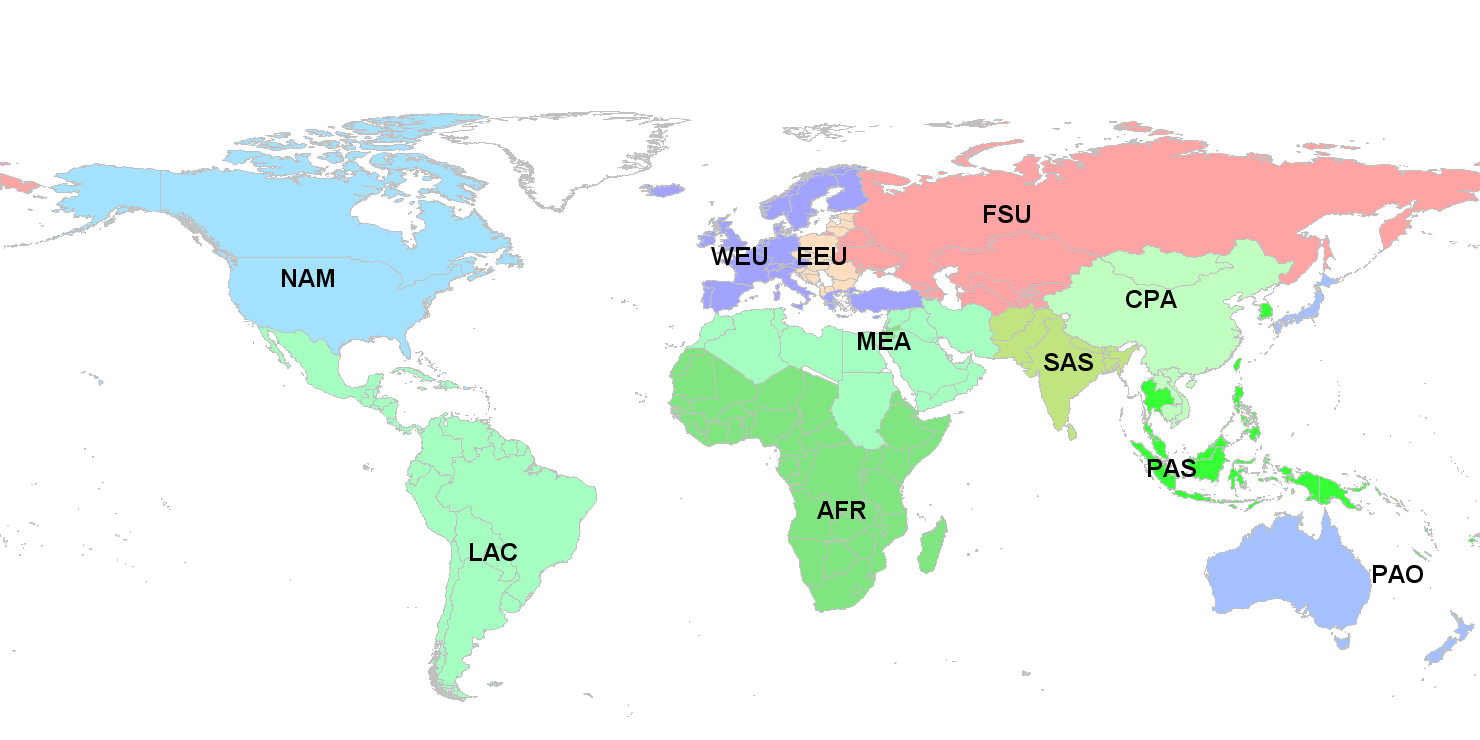
Aggregation on the 11 region level
Sub-Saharan Africa: Angola, Benin, Botswana, British Indian Ocean Territory, Burkina Faso, Burundi, Cameroon, Cape Verde, Central African Republic, Chad, Comoros, Cote d'Ivoire, Congo, Djibouti, Equatorial Guinea, Eritrea, Ethiopia, Gabon, Gambia, Ghana, Guinea, Guinea-Bissau, Kenya, Lesotho, Liberia, Madagascar, Malawi, Mali, Mauritania, Mauritius, Mozambique, Namibia, Niger, Nigeria, Reunion, Rwanda, Sao Tome and Principe, Senegal, Seychelles, Sierra Leone, Somalia, South Africa, Saint Helena, Swaziland, Tanzania, Togo, Uganda, Zaire, Zambia, Zimbabwe
Centrally planned Asia and China: Cambodia, China (incl. Hong Kong), Korea (DPR), Laos (PDR), Mongolia, Viet Nam
Central and Eastern Europe: Albania, Bosnia and Herzegovina, Bulgaria, Croatia, Czech Republic, Estonia, The former Yugoslav Rep. of Macedonia, Latvia, Lithuania, Hungary, Poland, Romania, Slovak Republic, Slovenia, Yugoslavia
Former Soviet Union: Armenia, Azerbaijan, Belarus, Georgia, Kazakhstan, Kyrgyzstan, Republic of Moldova, Russian Federation, Tajikistan, Turkmenistan, Ukraine, Uzbekistan (the Baltic republics are in the Central and Eastern Europe region)
Latin America and the Caribbean: Antigua and Barbuda, Argentina, Bahamas, Barbados, Belize, Bermuda, Bolivia, Brazil, Chile, Colombia, Costa Rica, Cuba, Dominica, Dominican Republic, Ecuador, El Salvador, French Guyana, Grenada, Guadeloupe, Guatemala, Guyana, Haiti, Honduras, Jamaica, Martinique, Mexico, Netherlands Antilles, Nicaragua, Panama, Paraguay, Peru, Saint Kitts and Nevis, Santa Lucia, Saint Vincent and the Grenadines, Suriname, Trinidad and Tobago, Uruguay, Venezuela)
Middle East and North Africa: Algeria, Bahrain, Egypt (Arab Republic), Iraq, Iran (Islamic Republic), Israel, Jordan, Kuwait, Lebanon, Libya/SPLAJ, Morocco, Oman, Qatar, Saudi Arabia, Sudan, Syria (Arab Republic), Tunisia, United Arab Emirates, Yemen
North America: Canada, Guam, Puerto Rico, United States of America, Virgin Islands
Pacific OECD: Australia, Japan, New Zealand
Other Pacific Asia: American Samoa, Brunei Darussalam, Fiji, French Polynesia, Gilbert-Kiribati, Indonesia, Malaysia, Myanmar, New Caledonia, Papua, New Guinea, Philippines, Republic of Korea, Singapore, Solomon Islands, Taiwan (China), Thailand, Tonga, Vanuatu, Western Samoa
South Asia: Afghanistan, Bangladesh, Bhutan, India, Maldives, Nepal, Pakistan, Sri Lanka
Western Europe: Andorra, Austria, Azores, Belgium, Canary Islands, Channel Islands, Cyprus, Denmark, Faeroe Islands, Finland, France, Germany, Gibraltar, Greece, Greenland, Iceland, Ireland, Isle of Man, Italy, Liechtenstein, Luxembourg, Madeira, Malta, Monaco, Netherlands, Norway, Portugal, Spain, Sweden, Switzerland, Turkey, United Kingdom
Citation
Please cite the database as:
De Stercke, S., 2014. Dynamics of Energy Systems: a Useful Perspective (IIASA Interim Report No. IR-14-013). International Institute for Applied Systems Analysis (IIASA), Laxenburg, Austria.
Disclaimer
Liability
With respect to information available from this webpage, neither IIASA nor any of its employees make any warranty, expressed or implied, including warranties of merchantability and fitness for a particular purpose, nor does IIASA assume any legal liability or responsibility for the accuracy, completeness, or usefulness of any information, product, or process disclosed, nor does IIASA represent that its use would not infringe upon privately owned rights. The software is provided on an 'as is' basis and IIASA disclaims all liability of any kind whatsoever arising out of the use, or inability to use, the databases and all information and data contained within them. Parts of the pages or the complete model might be extended, changed or partly or completely deleted without separate announcement.
Referrals and links
This website may contain advice, opinions and statements from external websites. Hyperlinks to non-IIASA Internet sites do not imply any official endorsement of, or responsibility for, the opinions, ideas, data or products presented at these locations nor guarantee the validity of the information provided. The sole purpose of links to other sites is to indicate further information available on related topics.
Copyright
The information supplied on this site or parts thereof may be freely used for non-commercial and educational purposes. Data from this site is for informational purposes only. Information from this site may be reproduced with proper acknowledgment as defined within the databases. Individual documents on this webpage may have different copyright conditions than IIASA; these conditions will be noted in the respective documents. Views or opinions expressed herein do not necessarily represent those of IIASA, its National Member Organizations, or other supporting institutions.
Responsible for this page: PFU database administrators.