
Public GEA Scenario Database
The GEA scenario database aims at documenting results and assumptions of the GEA transformation pathways. The database serves as a central data-repository for the dissemination of GEA scenario information. The pathways in this database underpin he majority of the work in GEA Chapter 17 and users should refer to that text for a discussion of the results.
A short tutorial on the use of the web database can be found below. If you experience technical problems with this database, please contact the GEA database administrators.
A short tutorial on the use of the database
Navigation tabs
At the upper end of the browser window five navigation tabs can be found that provide different functionality of the web database. These five tabs are described in more detail in the following section. The data in the GEA database can be viewed online through four of the tabs shown on top of the screen, “Regions”, “Sectors”, “Series” and “Countries”, all of which present the data from a slightly different perspective.About tab
The “About” page, which you are currently reading, provides information about the database, the GEA transition pathways, and the scenario development process, as well as instructions on how to use the database.
Regions tab
The “Regions” view allows selecting a single variable from a single pathway (e.g. total GDP in Market Exchange Rate for an illustrative pathway from one of the two models) in order to compare this selection across different regions (11, 5 or 2, see region definitions). For variables that can be added in a meaningful way (e.g. GDP, total primary energy consumption) the graph that appears on the right hand side will be a stacked are graph while for variables that are not additive (e.g. price information) a line graph will be displayed.
Sectors tab
The “Sectors” view allows selecting multiple variables from a single pathway and region. This view is most useful for displaying a set of variables from one sector, for example, all fuel types of industrial final energy consumption. Again, if the variables can be added in a meaningful way (e.g. different fuel types of one sector) a stacked area graph is shown; if this is not possible (e.g. for different fuel prices) a line graph is displayed. In case variables with different units are selected a warning is issued on the y-axis label of the graph in red. Please note that it is necessary to mark a variable name (highlighted in blue) in addition to selecting variables for the graph on the right hand side to be updated (see also under (3.) Variables below).
Series tab
The “Series” view allows selecting a single variable from multiple pathways and regions. The preview graph on the right is always a line graph and is most useful to compare trends across different pathways in one or multiple regions.
Countries tab
The “Countries” view is similar to the “Series” view, but allows viewing of population and GDP data per country, rather than aggregated per region. Only a few variables are available at the country level because most were only modelled in aggregate regions or globally.
Database view structure
When viewing the database through any of the four tabs indicating different aggregations of data (i.e. “Regions”, “Sectors”, “Series” or “Countries”), the following query fields are in the left upper middle of the screen:
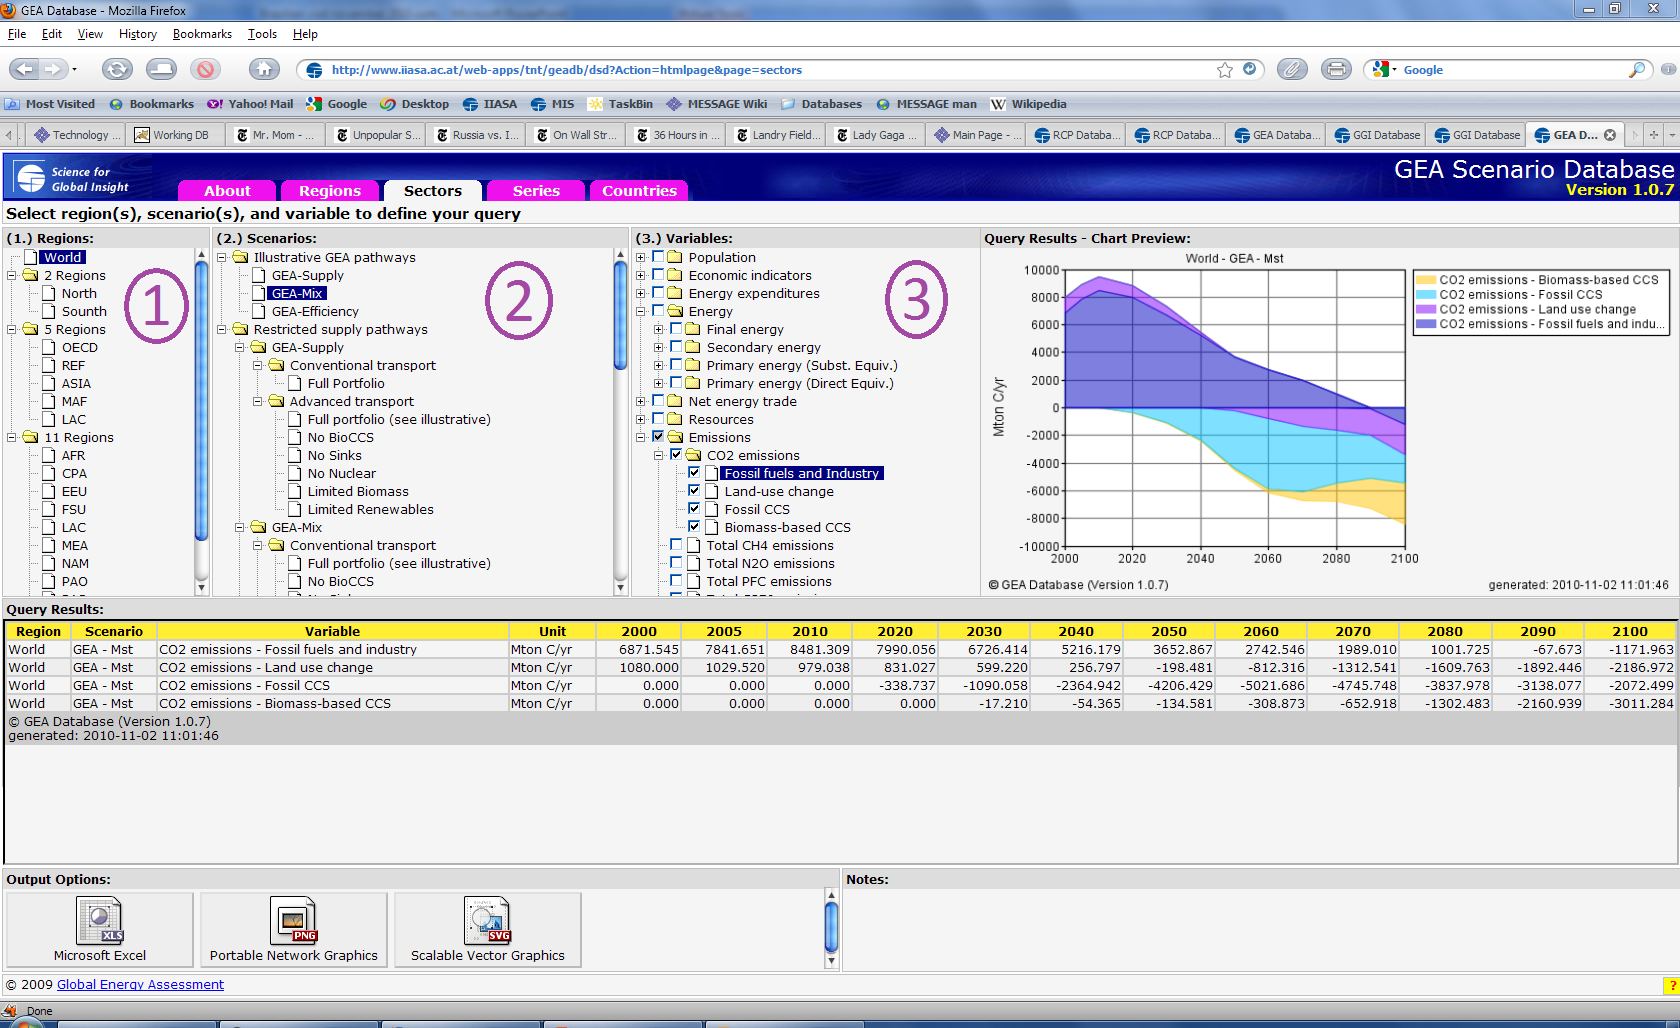
(1) Regions
In the upper left area of the screen is a field named “Regions”. This field is used for choosing the region or regions for which the data is shown. If data is aggregated over sectors (i.e. data is accessed through the tab “Sectors”), only single region can be chosen at a time.
(2) Scenarios
This field is used for choosing the pathway(s) for which the data is shown. Multiple pathways can be chosen simultaneously only if the aggregation method used is “Series”.
(3) Variables
This field is used for choosing the variable or variables for which the data is shown. Note that if the aggregation used is “Series” or “Regions”, only a single variable can be presented at a time.
The desired variables are selected by ticking the box next to the desired variable in the Query Results field. This allows you to define the required aggregation freely – all variables marked will be included in the aggregation. If no tick box is shown only a single variable can be selected and you may want to change to a different view.
Note you must tick at least one box or select a variable in each of the three input fields and click on any of the input options to generate (updated) figures and tables!
The output fields show a graphical and numerical view of the chosen data:
Query Results - Chart Preview
Displays a graph of the chosen on the right of the screen. The graph is either a stacked coloured graph or line graph in the “Regions” or “Sectors” views, and a line graph for the “Series” and “Countries” views.
Query Results
Shows the results in numerical format.
Output Options
Allows exporting of the GEA pathway data into MS Excel or to higher-resolution PNG or SVG graphical formats (graph open in a new window).
Notes
Shows any information that is relevant to interpreting the chosen variables. If you hover your pointer over the ? box in the far bottom right, you will see information about the pathway and variable names that the database uses internally.
Transition Pathways for Sustainable Development
The GEA comprises essentially one single normative scenario of the transition to a sustainable energy system. Within this single scenario, alternative pathways are developed, which describe transformations towards normative objectives for energy access, environmental impacts of energy conversion and use, and energy security. All pathways fulfill these objectives by reaching specific and clear targets. For example, the pathways all stabilize future global mean temperature increase to 2°C above preindustrial levels, and they all lead to (almost) universal access to energy services throughout the world by 2030.
Objectives and Targets for Sustainable Energy:
The definition of the GEA targets is of central importance, since they define the ambition level and the magnitude and pace of the transformation depicted by the GEA pathways. The targets are thus major drivers of the pathways presented in the database. To a large extent the targets also define the policy stringency and portfolio of measures to respond to the normative objectives. Table 1 summarizes the main target levels adopted for the Assessment. These are used in the analysis of pathways to a sustainability energy system as the main boundary conditions or formal constraints in the integrated assessment modeling frameworks MESSAGE and IMAGE. The targets are defined in quantitative terms and prescribe a specific time schedule for when a certain objective needs to be met. They cover objectives for all four principal energy challenges: energy access; air pollution and health; climate change; energy security.
Table 1: Targets for the four main energy challenges with key characteristics of the transition pathways relevant to each challenge.
|
Objective |
Target & Timeline |
Pathway Characteristics |
|
Improve Energy Access |
Universal access to electricity and modern cooking fuels by 2030. |
Diffusion of clean & efficient cooking appliances; Extension of both high voltage electricity grids and decentralized micro-grids; Increased financial assistance from industrialized countries to support clean energy infrastructure. |
|
Reduce Air Pollution / Improve Human Health |
Achieve global compliance with WHO air quality standards (PM2.5 < 35 μg/m³) by 2030 |
Tightening of technology standards across transportation and industrial sectors (e.g., vehicles, shipping, power generation, industrial processes); Decarbonization to support pollutant emissions controls; Fuel switching from traditional biomass to modern energy forms for cooking in developing countries. |
|
Avoid Dangerous Climate Change |
Limit global average temperature change to 2°C above pre-industrial levels with a likelihood of >50% |
Widespread diffusion of zero- and low-carbon energy supply technologies, with substantial reductions in energy intensity; Global CO2 emissions peak by 2020, and are reduced to 30-75% by 2050 on 2000 levels; Globally comprehensive mitigation efforts covering all major emitters; Financial transfers from industrialized countries to support decarbonization. |
|
Improve Energy Security |
Limit energy trade; Increase diversity & resilience of energy supply (both by 2050). |
Increase in local energy supply options (e.g., renewables to provide 30-75% of primary energy by 2050); Increase in diversity of imported fuels and reduce dependency (e.g., reduce share of oil imports in primary energy by 30%-80% by 2050 compared to 2000); Infrastructure expansion and upgrades to support interconnections and backup, including increased capacity reserves, stockpiles, and energy storage technologies. |
Combination of demand and supply-side measures:
The main aim of the GEA pathways is to provide a better understanding of what combination of measures, over which time-frames, and at what costs are needed to deliver the necessary solutions. A critical factor is to which extent changes in the level of demand for energy services together with demand-side efficiency measures can reduce energy consumed to provide mobility, housing and industrial services and thus help to fulfill the goals across virtually the whole range of sustainability objectives.
At low energy demand, many alternative supply-side configurations might be possible to fulfill the aspirational goals of the GEA. By contrast, less emphasis on energy demand will require a much more rapid expansion of a broader portfolio of supply-side options. Hence, the successful implementation of demand-side policies increases the flexibility of supply-side options (and vice versa).
Figure 1 gives an illustration of this concept, which is used as the scenario logic of the GEA pathways. Three GEA pathway groups, simply labeled GEA-Efficiency, GEA-Mix, and GEA-Supply, are constructed to represent different emphases in terms of demand-side and supply-side changes. Each group varies in particular with respect to assumptions about the comprehensiveness of demand-side policies to enhance efficiency, leading to pathways of comparatively low energy demand (GEA-Efficiency), intermediate demand (GEA-Mix), and high demand (GEA-Supply). Within each group, a range of alternative pathways for the supply-side transformation are explored.
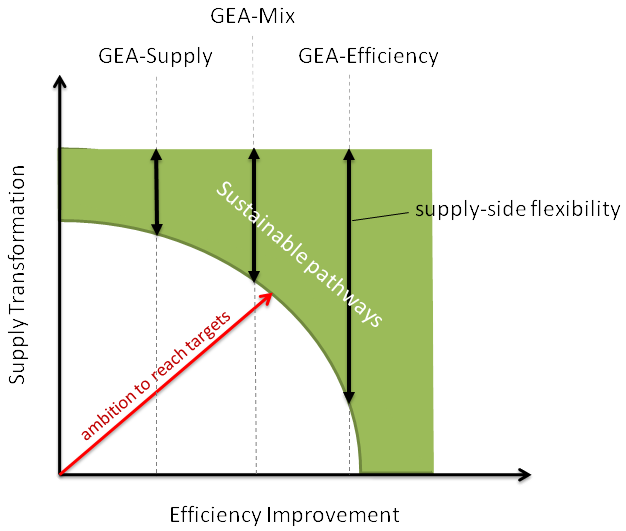
Figure 1: Schematic illustration of the GEA pathways. The different pathways (GEA-Supply, GEA-Mix, and GEA-Efficiency) explore alternative combinations of efficiency improvements and supply-side transformations to achieve ambitious targets for sustainable development. The ambitiousness of the targets defines the feasibility frontier for the combinations of supply and efficiency measures. High levels of efficiency improvements, as depicted by the GEA-Efficiency pathways, increase the supply-side flexibility to reach the targets, and vice versa, the rapid transformation of supply increases the flexibility for the required efficiency improvements to limit energy demand.
GEA Branching points:
The alternative GEA pathways fulfill the normative objectives set out for the global energy system. Moving from these objectives to a specific pathway entails three critical choices or 'branching points' (see Table 2). The first branching point describes alternative levels of energy demand and efficiency improvements, and leads to distinct pathway groups of low, high and intermediate demand (GEA-Efficiency, GEA-Supply and GEA-Mix respectively).
Another branching point explores alternative transformations on the supply-side with the main aim to test the flexibility of different supply-side configurations to fulfill the GEA sustainability objectives given the levels of energy demand resulting from the first branching point. One aim was specifically to understand whether any of the supply options were mandatory. This was explored by constraining the portfolio of supply-side options by prohibiting or limiting the availability of a particular technology, including nuclear, carbon capture and storage, biomass, and renewables.
A further branching point, whose importance was revealed by this supply-side analysis, concerns changes in the transportation system. A 'conventional' transportation system relying on liquid fuels has substantively different implications for supply-flexibility compared to an 'advanced' transportation system dominated by electric or hydrogen-powered vehicles. Although any major transformation in an end use sector that entails fuel switching will impact the energy supply, the magnitude of impact from transformations in the transportation systems warranted its inclusion as an explicit branching point.
Table 2: Branching points and GEA pathways.
|
Branching point (1): |
Branching point (2): |
Branching point (3): |
|
GEA-Efficiency (low demand) GEA-Supply (high demand) GEA-Mix (intermediate demand) |
Conventional Transportation (liquid fuels) Advanced Transportation (electricity / hydrogen) |
Full Portfolio (all options) Restricted Portfolio (excludes or limits particular options): |
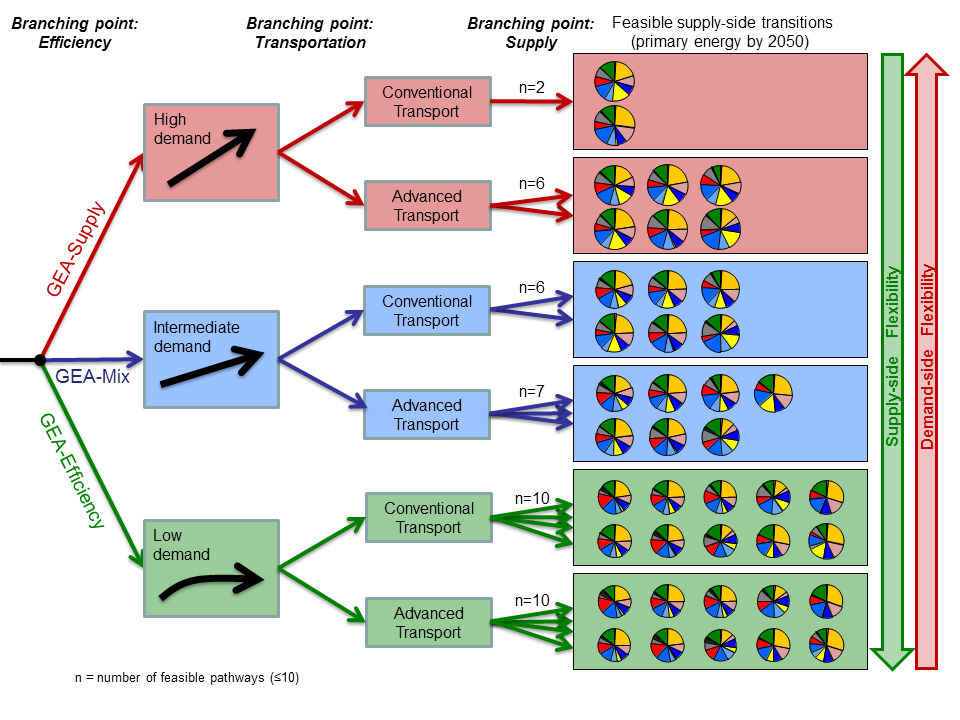
Figure 2: Schematic illustration of the GEA pathways and the three branching points. The scenario setup features alternative choices for the combination of demand-side efficiency improvements and supply-side transformations, describing alternative policy emphases that would enable the transformation toward a sustainable energy system. The pie charts represent primary energy portfolios of feasible transformation pathways under different branching point assumptions.
GEA scenario development process
The pathways were developed in parallel by two integrated assessment frameworks, MESSAGE and IMAGE, through an iterative process to achieve integration across various Chapter of the GEA. Figure 3 below gives a schematic diagram of the scenario development process, the flow of information from the GEA chapter teams to the scenario development team and the iterations across various knowledge-clusters. The figure shows how GEA indicators and KM inputs lead to the three illustrative pathways and through an iterative procedure and sensitivity analyses generates robust policy implications.
Two alternative modelling frameworks based on different methodologies are used so as to indicate to what extent the pathway outcomes differ and thereby encompass some of the methodological uncertainties in dealing with the complex phenomena associated with energy systems transformations. MESSAGE model has a highly disaggregated energy systems description while IMAGE has a more disaggregated land use descriptions. In this sense, the two modelling frameworks are complementary. Even though the emphasis of GEA pathways is on energy systems, transformational change of the three illustrative pathways requires a very careful look at the land-use implications and potential conflicts between food and energy production.
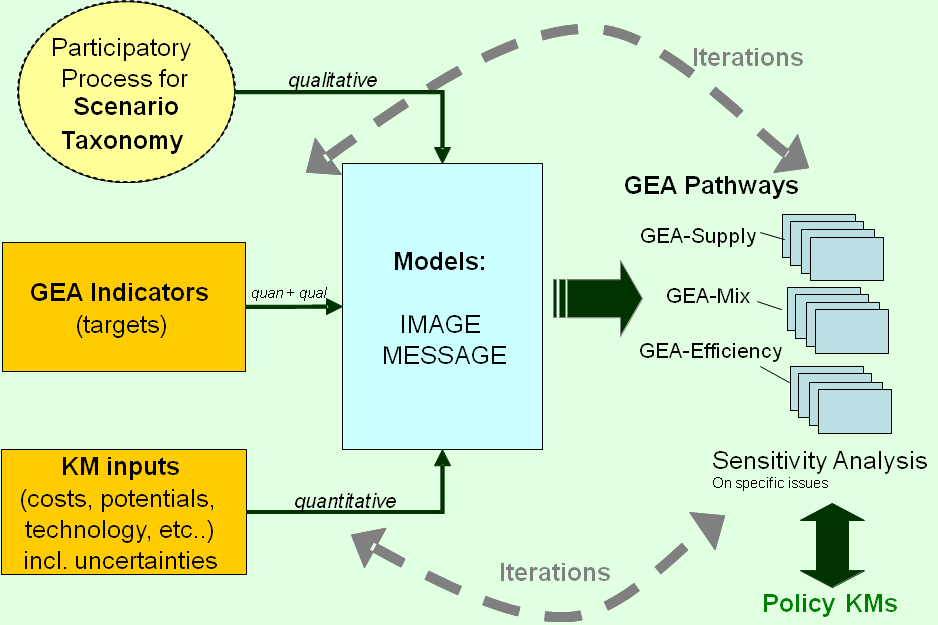
Figure 3: GEA scenario development process that shows how GEA indicators and chapter team inputs lead to the three illustrative pathways outcomes and through an iterative procedure and sensitivity analyses generates robust policy implications.
Definition of regional acronyms used in the database
The results in the database are shown with varying regional aggregation; some data is available only globally, some on the level of 11 global regions. The following is a list of the acronyms used for the regions and the countries that are included in each region.
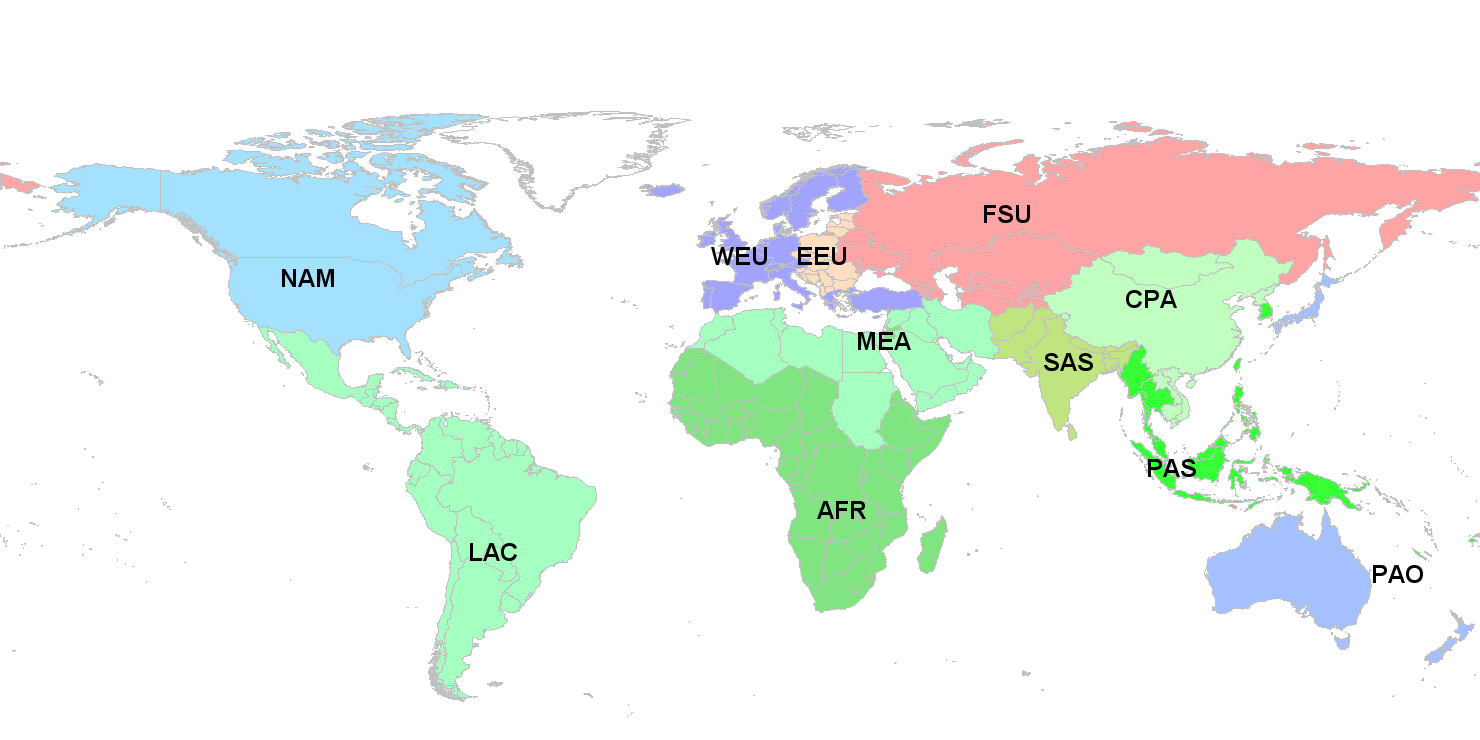
Aggregation on the 11 region level
Sub-Saharan Africa: Angola, Benin, Botswana, British Indian Ocean Territory, Burkina Faso, Burundi, Cameroon, Cape Verde, Central African Republic, Chad, Comoros, Cote d'Ivoire, Congo, Djibouti, Equatorial Guinea, Eritrea, Ethiopia, Gabon, Gambia, Ghana, Guinea, Guinea-Bissau, Kenya, Lesotho, Liberia, Madagascar, Malawi, Mali, Mauritania, Mauritius, Mozambique, Namibia, Niger, Nigeria, Reunion, Rwanda, Sao Tome and Principe, Senegal, Seychelles, Sierra Leone, Somalia, South Africa, Saint Helena, Swaziland, Tanzania, Togo, Uganda, Zaire, Zambia, Zimbabwe
Centrally planned Asia and China: Cambodia, China (incl. Hong Kong), Korea (DPR), Laos (PDR), Mongolia, Viet Nam
Central and Eastern Europe: Albania, Bosnia and Herzegovina, Bulgaria, Croatia, Czech Republic, Estonia, The former Yugoslav Rep. of Macedonia, Latvia, Lithuania, Hungary, Poland, Romania, Slovak Republic, Slovenia, Yugoslavia
Former Soviet Union: Armenia, Azerbaijan, Belarus, Georgia, Kazakhstan, Kyrgyzstan, Republic of Moldova, Russian Federation, Tajikistan, Turkmenistan, Ukraine, Uzbekistan (the Baltic republics are in the Central and Eastern Europe region)
Latin America and the Caribbean: Antigua and Barbuda, Argentina, Bahamas, Barbados, Belize, Bermuda, Bolivia, Brazil, Chile, Colombia, Costa Rica, Cuba, Dominica, Dominican Republic, Ecuador, El Salvador, French Guyana, Grenada, Guadeloupe, Guatemala, Guyana, Haiti, Honduras, Jamaica, Martinique, Mexico, Netherlands Antilles, Nicaragua, Panama, Paraguay, Peru, Saint Kitts and Nevis, Santa Lucia, Saint Vincent and the Grenadines, Suriname, Trinidad and Tobago, Uruguay, Venezuela)
Middle East and North Africa: Algeria, Bahrain, Egypt (Arab Republic), Iraq, Iran (Islamic Republic), Israel, Jordan, Kuwait, Lebanon, Libya/SPLAJ, Morocco, Oman, Qatar, Saudi Arabia, Sudan, Syria (Arab Republic), Tunisia, United Arab Emirates, Yemen
North America: Canada, Guam, Puerto Rico, United States of America, Virgin Islands
Pacific OECD: Australia, Japan, New Zealand
Other Pacific Asia: American Samoa, Brunei Darussalam, Fiji, French Polynesia, Gilbert-Kiribati, Indonesia, Malaysia, Myanmar, New Caledonia, Papua, New Guinea, Philippines, Republic of Korea, Singapore, Solomon Islands, Taiwan (China), Thailand, Tonga, Vanuatu, Western Samoa
South Asia: Afghanistan, Bangladesh, Bhutan, India, Maldives, Nepal, Pakistan, Sri Lanka
Western Europe: Andorra, Austria, Azores, Belgium, Canary Islands, Channel Islands, Cyprus, Denmark, Faeroe Islands, Finland, France, Germany, Gibraltar, Greece, Greenland, Iceland, Ireland, Isle of Man, Italy, Liechtenstein, Luxembourg, Madeira, Malta, Monaco, Netherlands, Norway, Portugal, Spain, Sweden, Switzerland, Turkey, United Kingdom
Aggregation on the 5 region level
OECD 90: Countries that were OECD members in 1990, i.e. countries that make up the Western Europe, North America and Pacific OECD regions.
Reforming Ecomonies: Countries of Central and Eastern Europe and the Former Soviet Union undergoing economic reform.
Asia: This region includes the Asian countries that make up the South Asia, Centrally planned Asia and China and Other Pacific Asia regions.
Middle East and Africa: This region includes the African and Middle Eastern countries that make up the Sub-Saharan Africa and Middle East and North Africa regions.
Latin America and the Caribbean: This region is the same as the Latin America and the Caribbean region in aggregation on the 11 region level.
Aggregation on the 2 region level
North = Industrialised countries, i.e. countries that make up the OECD 90 and Reforming Ecomonies regions.
South = Developing countries, i.e. countries that make up the Middle East and Africa, Asia and Latin America and the Caribbean regions.
Disclaimer
Liability
With respect to information available from this webpage, neither IIASA nor any of its employees make any warranty, expressed or implied, including warranties of merchantability and fitness for a particular purpose, nor does IIASA assume any legal liability or responsibility for the accuracy, completeness, or usefulness of any information, product, or process disclosed, nor does IIASA represent that its use would not infringe upon privately owned rights. The software is provided on an 'as is' basis and IIASA disclaims all liability of any kind whatsoever arising out of the use, or inability to use, the databases and all information and data contained within them. Parts of the pages or the complete model might be extended, changed or partly or completely deleted without separate announcement.
Referrals and links
This website may contain advice, opinions and statements from external websites. Hyperlinks to non-IIASA Internet sites do not imply any official endorsement of, or responsibility for, the opinions, ideas, data or products presented at these locations nor guarantee the validity of the information provided. The sole purpose of links to other sites is to indicate further information available on related topics.
Copyright
The information supplied on this site or parts thereof may be freely used for non-commercial and educational purposes. Data from this site is for informational purposes only. Information from this site may be reproduced with proper acknowledgment as defined within the databases. Individual documents on this webpage may have different copyright conditions than IIASA; these conditions will be noted in the respective documents. Views or opinions expressed herein do not necessarily represent those of IIASA, its National Member Organizations, or other supporting institutions.
Responsible for this page: GEA database administrators