
The GGI Scenario Database (Version 2.0)
Introduction
The GGI (Greenhouse Gas Initiative) scenario database documents the results of a set of greenhouse gas emission scenarios that were created using the IIASA Integrated Assessment Modeling Framework and previously documented in a special issue of the Technological Forecasting and Social Change. The articles of the special issue can be accessed here.
Altogether, the database documents three ‘baseline’ scenarios of different socio-economic and technological developments, A2r, B1 and B2, that are assumed not to include any explicit climate policies. In addition to these, this database also documents climate stabilization scenarios, which have been imposed on the baselines. Version 2.0 of the database includes an extended set of stabilization scenarios, including very low scenarios that stabilize CO2-eq concentrations at about 450 ppm CO2-eq.
The majority of the scenario data is presented at the level of 11 world regions. For some indicators data is available in a more disaggregated spatial scale than what is shown in this database. If you are interested in acquiring grid level data, it can be downloaded from here.
A short tutorial on the use of the database
Setup of the structure
When entering the database through any of the three tabs indicating different aggregations of data (i.e. “Regions”, “Sectors”, “Series” and “Countries”), the following query fields are shown on the screen:
(1) Regions: In the upper left area of the screen is a field named “Regions”. This is used for choosing the region or regions for which the data is to be shown. If data is aggregated over sectors (i.e. data is accessed through the tab “Sectors”), only single region can be chosen at a time.
(2) Scenarios: This field allows the user to choose the scenario(s) for which the data is required. Multiple scenarios can be chosen simultaneously only if the aggregation method used is “Series”.
(3) Variables: In this field the variable or variables to be shown are chosen. Note that if the aggregation used is “Series” or “Regions”, only a single variable can be presented at a time.
The output fields available are the Query Results - Chart Preview on the right showing a graph of the chosen data, Query Results showing the results in numerical format and the Output options which allow to export the data either into excel or two different graphical formats. The field titled Notes shows any additional information there may be available for the chosen variables.
The data aggregation and presentation options
The data included in the database can be accessed through the three tabs shown on top of the screen, Series, Regions and Sectors all of which present the data from a slightly different perspective.
Aggregation Series: This option allows the user to choose individual time series from several scenarios and regions at the same time and present them together in the graphical format or in the data table. However, although many scenarios and regions can be presented at the same time, only one variable can be included at a time.
Aggregation Regions: With this option the user can choose a single scenario and a single variable and see the global results aggregated over the regions (11 or 4 regional base aggregation can be chosen). This allows the user to visualize regional contributions in a simple manner.
Aggregation Sectors: This aggregation tool can be used to aggregate data for a single region and a single scenario, but for as many variables as required. The basic purpose of this tool is to visualize, for example, the total electricity generation and primary energy palette of a region with a single graph. The variables that are to be included to the aggregated figure and to the numerical data given in the Query Results field have to marked by ticking the box next to the desired variable. This allows the user to define the required aggregation freely – all variables marked will be included in the aggregation with no exceptions.
Taxonomy and main characteristics of the scenarios
The scenarios presented in this database derive from, and use the naming conventions of, the scenarios presented in the IPCC Special Report on Emissions Scenarios (SRES). The original scenarios presented in SRES have been revised to reflect new information and to incorporate the results of scenario analyses performed with the help of the integrated modeling and assessment framework with the aim to improve scenario consistency. One scenario (labeled as ‘A2r’), while maintaining its main structural and qualitative characteristics, represents a major numerical revision that reflects the most recent long-term demographic outlook with a corresponding lowering of future world population growth.
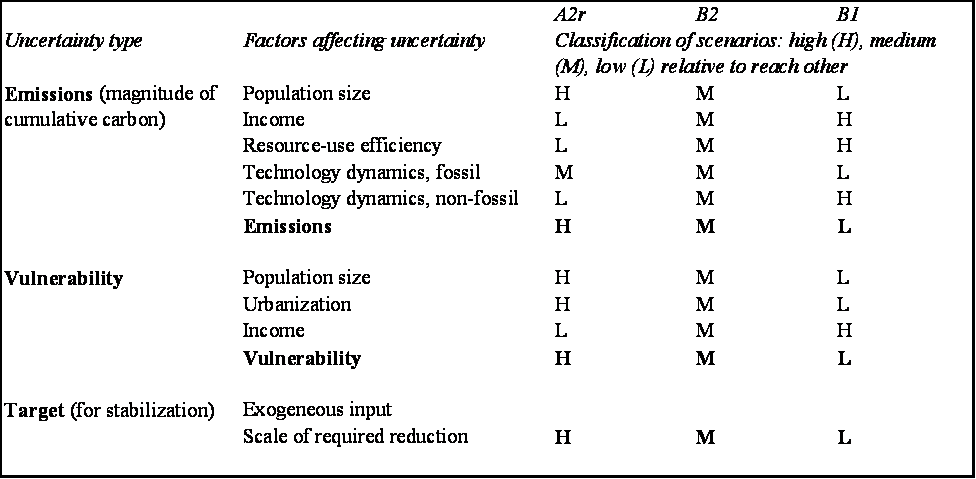
The main objective of the exercise has been to explore the feasibility and costs of meeting alternative climate stabilization targets under a range of salient long-term uncertainties with a limited set of scenarios. Table 1 summarizes the three baseline scenarios in terms of the uncertainties examined. The two main examples of these uncertainties presented in the database are:
- Development pathway uncertainty, which includes alternative demographic, economic, and technological developments that lead to high (A2r), intermediary (B2), or low (B1) emissions of GHGs and hence magnitude of future climate change.
- Climate stabilization target uncertainty is addressed by systematic model simulations for a range of alternative climate stabilization targets imposed on the no-policy baseline scenarios. Altogether, calculations for 11 stabilization scenarios for eight comparable stabilization levels has been performed.
Table 1. Taxonomy of Scenarios
A qualitative description of the ‘narratives’, or ‘storylines’, of the three baseline scenarios, can be found, for example, in one of the articles documenting this scenario exercise (to download the article, click here).
A brief description of the methodology behind the scenarios
A set of interlinked disciplinary and sectorial models, together called the IIASA Integrated Assessment Modeling Framework, was used to create and evaluate the scenarios presented in this database (see figure 1).
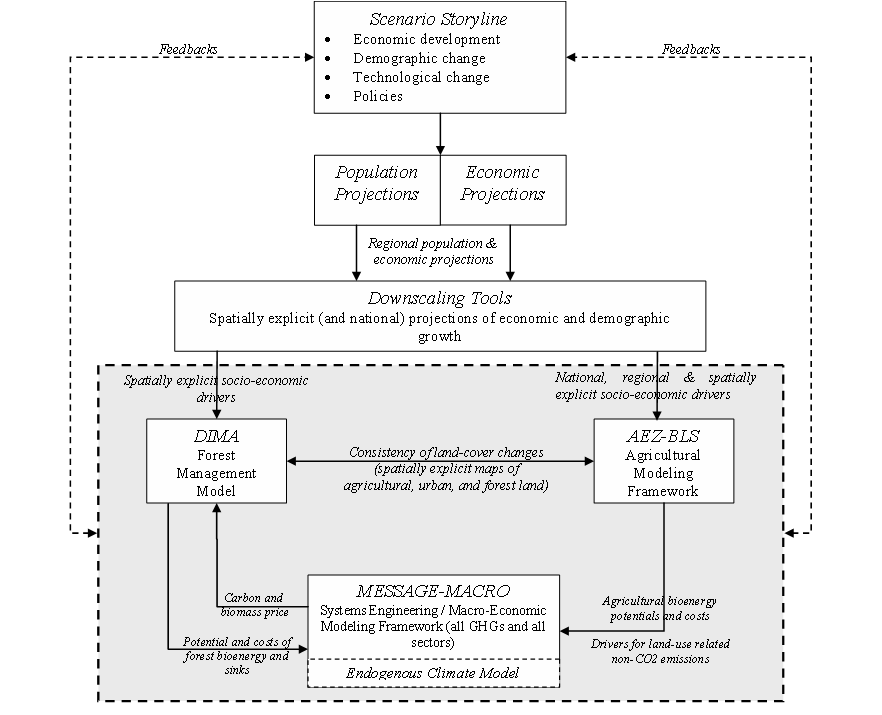
Figure 1. IIASA Integrated Assessment Modeling Framework
The framework shown in figure 1 combines a careful blend of rich disciplinary models that operate at different spatial resolutions that are interlinked and integrated into an overall assessment framework. The framework covers all GHG-emitting sectors, including agriculture, forestry, energy, and industrial sources for a full basket of GHGs, including CO2, CH4, N2O, hydrofluorocarbons (HFCs), CF4, and SF6. Integration is achieved through a series of hard and soft linkages between the individual components, to ensure internal scenario consistency and plausibility.
The three principal models of the IA framework are DIMA (forest management model), AEZ-BLS (agricultural modeling framework), and MESSAGE-MACRO (energy systems engineering/macro-economic modeling framework). Figure 2 shows the energy chain included in MESSAGE, representing the energy system from resource extraction, conversion, transport, and distribution, to the provision of energy end-use services.
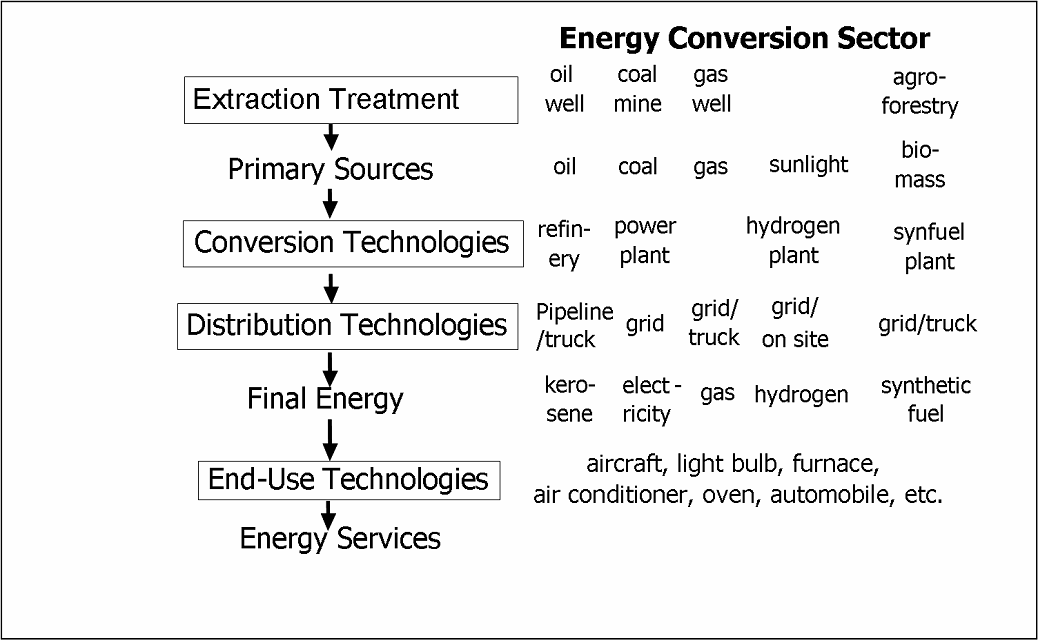
Figure 2. The Reference Energy System
Integration of agriculture and forestry sectors in the MESSAGE-MACRO framework has been achieved through linkages to the DIMA and AEZ-BLS models. While, potentials for bioenergy supply and CO2 mitigation via forest-sink enhancement are based on sensitivity analysis of the DIMA model, the AEZ-BLS framework provides important inputs with respect to agricultural drivers of GHG emissions, such as changes in rice cultivation, animal stock, and fertilizer use. In that sense, the MESSAGE-MACRO stands at the heart of the fully integrated assessment framework. Its principal results comprise the estimation of technologically specific multi-sector response strategies for a range of alternative climate stabilization targets.
The definition of regional acronyms used in the database
The results in the database are shown with varying regional aggregation; some data is available only globally, some on the level of 11 global region and some can be attained even for grid cell level. The Following is a list of the acronyms used for the regions as well as the countries that are included in each of regions.
Aggregation on the 11 region level
NAM = North America (Canada, Guam, Puerto Rico, United States of America, Virgin Islands)
WEU = Western Europe (Andorra, Austria, Azores, Belgium, Canary Islands, Channel Islands, Cyprus, Denmark, Faeroe Islands, Finland, France, Germany, Gibraltar, Greece, Greenland, Iceland, Ireland, Isle of Man, Italy, Liechtenstein, Luxembourg, Madeira, Malta, Monaco, Netherlands, Norway, Portugal, Spain, Sweden, Switzerland, Turkey, United Kingdom)
PAO = Pacific OECD (Australia, Japan, New Zealand)
EEU = Central and Eastern Europe (Albania, Bosnia and Herzegovina, Bulgaria, Croatia, Czech Republic, The former Yugoslav Rep. of Macedonia, Hungary, Poland, Romania, Slovak Republic, Slovenia, Yugoslavia)
FSU = Newly independent states of the former Soviet Union (Armenia, Azerbaijan, Belarus, Estonia, Georgia, Kazakhstan, Kyrgyzstan, Latvia, Lithuania, Republic of Moldova, Russian Federation, Tajikistan, Turkmenistan, Ukraine, Uzbekistan)
CPA = Centrally planned Asia and China (Cambodia, China (incl. Hong Kong), Korea (DPR), Laos (PDR), Mongolia, Viet Nam)
SAS = South Asia (Afghanistan, Bangladesh, Bhutan, India, Maldives, Nepal, Pakistan, Sri Lanka)
PAS = Other Pacific Asia (American Samoa, Brunei Darussalam, Fiji, French Polynesia, Gilbert-Kiribati, Indonesia, Malaysia, Myanmar, New Caledonia, Papua, New Guinea, Philippines, Republic of Korea, Singapore, Solomon Islands, Taiwan (China), Thailand, Tonga, Vanuatu, Western Samoa)
MEA = Middle East and North Africa (Algeria, Bahrain, Egypt (Arab Republic), Iraq, Iran (Islamic Republic), Israel, Jordan, Kuwait, Lebanon, Libya/SPLAJ, Morocco, Oman, Qatar, Saudi Arabia, Sudan, Syria (Arab Republic), Tunisia, United Arab Emirates, Yemen)
LAM = Latin America and the Caribbean (Antigua and Barbuda, Argentina, Bahamas, Barbados, Belize, Bermuda, Bolivia, Brazil, Chile, Colombia, Costa Rica, Cuba, Dominica, Dominican Republic, Ecuador, El Salvador, French Guyana, Grenada, Guadeloupe, Guatemala, Guyana, Haiti, Honduras, Jamaica, Martinique, Mexico, Netherlands Antilles, Nicaragua, Panama, Paraguay, Peru, Saint Kitts and Nevis, Santa Lucia, Saint Vincent and the Grenadines, Suriname, Trinidad and Tobago, Uruguay, Venezuela)
AFR = Sub-Saharan Africa (Angola, Benin, Botswana, British Indian Ocean Territory, Burkina Faso, Burundi, Cameroon, Cape Verde, Central African Republic, Chad, Comoros, Cote d'Ivoire, Congo, Djibouti, Equatorial Guinea, Eritrea, Ethiopia, Gabon, Gambia, Ghana, Guinea, Guinea-Bissau, Kenya, Lesotho, Liberia, Madagascar, Malawi, Mali, Mauritania, Mauritius, Mozambique, Namibia, Niger, Nigeria, Reunion, Rwanda, Sao Tome and Principe, Senegal, Seychelles, Sierra Leone, Somalia, South Africa, Saint Helena, Swaziland, Tanzania, Togo, Uganda, Zaire, Zambia, Zimbabwe)
Aggregation on the 4 region level
OECD = Includes the OECD countries, therefore encompassing the countries included above in the regions WEU, NAM and PAO.
REF = Countries undergoing economic reform, i.e. countries listed under the regions EEU and FSU above.
ASIA = The countries included in the regions SAS, PAS and CPA are aggregated into this region.
ALM = This region includes the Latin American and African countries that make up the regions AFR, LAM and MEA above.
Citation
The suggested citation for data from the “GGI Scenario Database” web application is:
International Institute for Applied System Analysis (IIASA)
GGI Scenario Database Ver 2.0, 2009
Available at: http://www.iiasa.ac.at/Research/GGI/DB/
Riahi K, Nakicenovic N (eds) (2007). Greenhouse Gases - Integrated Assessment, Technological Forecasting and Social Change, Special Issue, 74(7): 873-1108, (ISSN 0040-1625).
Rao S, Riahi K, Stehfest E, van Vuuren DP, Cho C, den Elzen MGJ, Isaac M, van Vliet J (2008). IMAGE and MESSAGE Scenarios Limiting GHG Concentration to Low Levels, IIASA IIASA Interim Report IR-08-020, International Institute for Applied Systems Analysis, Laxenburg, Austria
Note that the database reflects the scenarios as of December 2006, and that the scenario information will be updated regularly to reflect the most recent publications available
Responsible for this page: GGI Database Webmaster